Maintaining consistent quality is essential for any business that aims to meet customer expectations and regulatory standards. To achieve this, organizations use specific tools that help identify, track, and eliminate quality issues throughout production or service delivery. These tools play a vital role in streamlining operations and driving continuous improvement.
What Are Quality Control Tools?
Quality Control Tools are methods and visual aids used to analyze, monitor, and enhance the quality of products and processes. They help teams collect data, understand performance trends, and solve problems in a structured way. From identifying process flaws to ensuring final product accuracy, these tools are fundamental to any quality management system.
The Role of Quality Control Tools in Business Efficiency
Businesses use Quality Control Tools to reduce variability, improve consistency, and prevent costly errors. When implemented effectively, these tools enhance decision-making and foster a culture of quality throughout the organization. By addressing problems early and accurately, companies can maintain high standards and boost customer satisfaction.
The Seven Basic Quality Control Tools
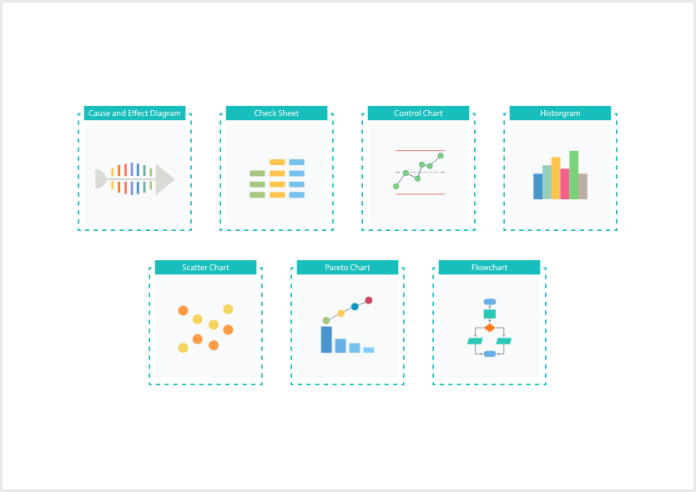
There are seven widely accepted Quality Control Tools that form the backbone of many quality assurance programs. Each serves a unique purpose and contributes to a deeper understanding of process behavior.
1. Cause-and-Effect Diagram
Also known as a fishbone or Ishikawa diagram, this tool helps teams identify the root causes of problems by categorizing potential sources of variation.
2. Flowchart
Flowcharts provide a visual representation of a process, making it easier to analyze each step and identify where improvements can be made.
3. Check Sheet
A simple yet powerful tool, the check sheet is used to collect and organize data in real time, especially for tracking defects or errors.
4. Histogram
Histograms display the frequency of data points in a process, helping identify patterns, variations, and areas that require attention.
5. Control Chart
Control charts are used to determine if a process is stable and within defined limits, helping detect unusual variations that may need intervention.
6. Pareto Chart
This chart highlights the most significant problems based on their frequency or impact, helping teams prioritize their quality improvement efforts.
7. Scatter Diagram
Scatter diagrams show the relationship between two variables, helping analyze whether one factor influences another in the production or service process.
Advantages of Using Quality Control Tools
Quality Control Tools provide businesses with a systematic approach to detecting inefficiencies and driving improvements. They lead to better resource management, reduced rework, increased customer trust, and more informed strategic decisions.
Conclusion
Incorporating Quality Control Tools into daily operations is essential for businesses aiming to achieve excellence. These tools not only help identify problems but also guide effective solutions. By mastering and applying these tools, organizations can enhance their processes, strengthen their reputation, and ensure long-term success.
